What Is Average Active Session aka AAS?
Are you familiar with AAS aka Average Active Session Metric? If not, don’t worry you are not the only one.
There are lots of good articles and slides on AAS, if you know to look for it.
What do you think of when you hear Average Active Sessions?
When I hear Average Active Sessions in the database, I would think about the actual number of sessions, you know, the users connected to the database and doing work.
But to be honest, this metric is not related totally to the number of connected users to the database. This metric is actually a great measuring stick for the performance in the database.
Before we dive in to understand this metric, we need to understand what the DB Time metric is, and what is the difference between DB Time and the actual Elapsed Time or Clock Time.
At any given time, there are users connected to the database, each of them performing some work, a query, an update…a report. Some sessions might be idle, some might be waiting on resources, some might be actively doing work. The sessions are using resources: CPU, I/O.
To make it clear, DB Time is not the same as Elapsed Time or Clock Time.
Oracle defines Database Time as the total time spent by foreground sessions executing database calls.
To better understand this concept, let’s look at a very simplified example.
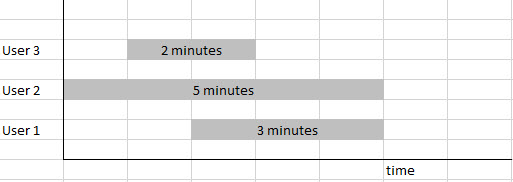
Lets say that there are 3 sessions in the database that are actively working.
The first session completes its work in 2 minutes.
The second session completes its work in 5 minutes.
The third session completes its work in 3 minutes.
Throughout this exercise, we are observing the database for a duration of 5 minutes.
In the above example, the Database Time is the total (sum) time spent by all three sessions 2+5+3=10 minutes.
The Clock Time is 5 minutes, since we observed the database for 5 minutes.
Do you see the difference between the DB Time and Clock/Elapsed Time?
In this example DB Time is greater than Clock Time. But it could be the other way around as well. If there was only one user connected and doing work for 2 minutes, the Database Time would be only 2 minutes.
And the Clock Time would still be 5 minutes, if I observed the database that long.
The Average Active Session is calculated as the DB Time divided by the Clock Time or Elapsed Time.
AAS=DBTime/ClockTime
In the example above the AAS=10/5=2
This is great information, but how does it help me?
There is one more piece of information that you need to know: how many CPUs are on the server where your database runs!
Once you figure out these two measures, AAS and number of CPUs, check the guideline below for measuring performance.
If AAS ~ 0 then the database is idle.
If AAS < 1 the database is fine
If AAS << # of CPUs the database is fine
If AAS ~ # of CPUs there might be performance problems
If AAS > # of CPUs there is definitely a performance problem.
You probably have more questions such as how do you determine the value of DB Time, AAS, # of CPUs … where can you find the information…
Tune in next week to get more questions answered!
If you enjoyed this article, and would like to learn more about databases, please sign up below, and you will receive
The Ultimate 3 Step Guide To Find The Root Cause Of The Slow Running SQL!


“There is one more piece of information that you need to know: how many CPUs are on the server where your database runs”
Is it the number of CPUs on the server or the number of CPUs assigned to the database i.e. CPU_COUNT?
So if I look at my enterprise manager on top activity and blue if going beyond the red line it is bad?
going beyond the red line is bad.
Really nice simple and clear article.
Thank you
Good writing as always .
kindly make the content font color more dark or bold style to improve the reading quality . This i requested before as well.
thanks and keep doing the good job !!!!
Hi Yaseen, the font has been changed and increased in size. Thank you for the feedback!